$301K
Median sale price
All El Paso, latest month
Episode 07
Median price, days on market & inventory · data through September 2026
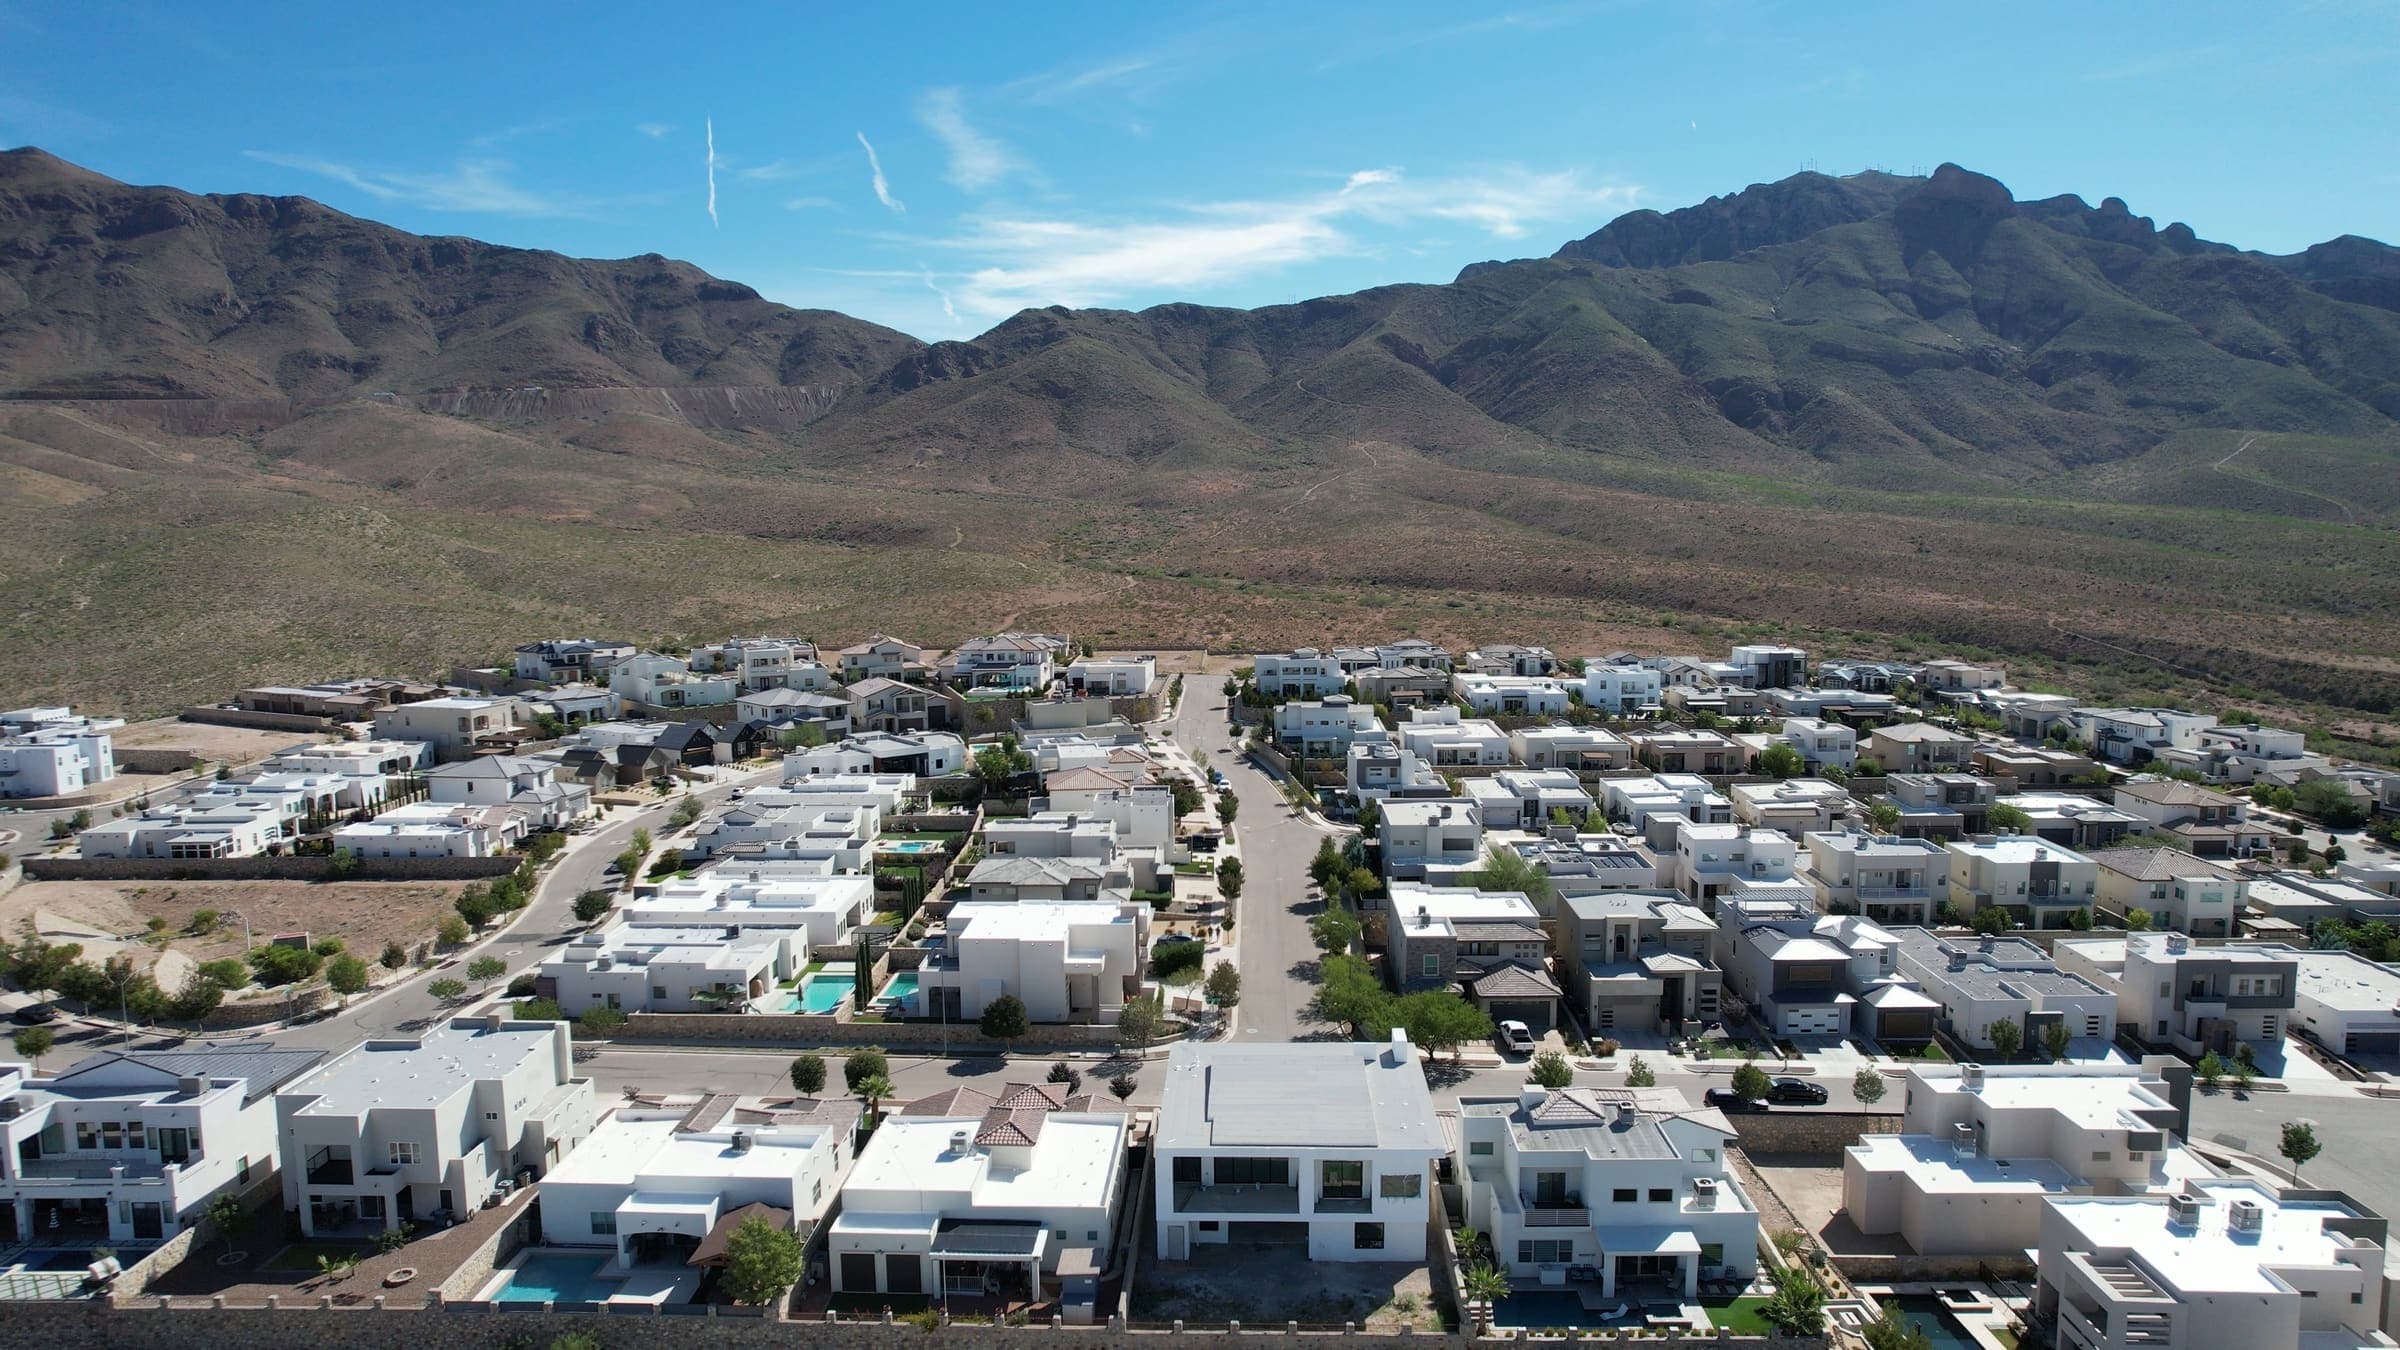 West El Paso
El Paso's median sale price is $301K as of September 2026, up 11.1% from a year earlier. Homes are averaging 67 days on market, with 676 sales closing in the latest month. Resale sellers got 97.0% of their original asking price. Measured against the final list price instead, after any price cuts, the same sales read 98.7%. Citywide supply is running at 3.8 months of inventory. Under six months of supply is generally read as a seller-leaning market. Those are metro-wide figures, and El Paso is not one market: the area you pick moves the number more than the citywide average does.
$301K
Median sale price
All El Paso, latest month
67 days
Days on market
676
Homes sold
97.0%
Of original asking price
Resale homes, price cuts included
8,845
Homes sold, past year
3.8
Months of inventory
78
Median days from listing to close
Based on 8,845 homes sold across El Paso in the 12 months to October 23, 2026, from the El Paso MLS.
Median price · All El Paso · range $265K–$301K
The same monthly analysis, on camera — in English and en español.
Source: Greater El Paso MLS (GEPAR) - FlexMLS Sold Market Analysis, Single Family Residence. Aggregated from per-ZIP data via PEPRG ZIP-to-Area map. Notes: Feb 2026 medianPrice was sourced from Sales Statistics by Zip Code (all-residential) since the Sold Market Analysis median column was not enabled for that pull; Mar 2026 onward uses Sold Market Analysis median (SFR-only). May 2026 entry refreshed to full-month (5/1-5/31) on 2026-06-10 (was partial through 5/11). medianPrice for multi-zip areas is weighted by homesSold across constituent zips (approximation; per-area filtered FlexMLS reports would give a true median). New Mexico (Santa Teresa 88008 + Sunland Park 88063, SFR) seeded 2026-06-20 from a 2026 year-to-date pull (1/1/2026-6/20/2026), homesSold-weighted across the two zips; it is a single YTD data point (NOT a calendar month like the El Paso series) and is deliberately excluded from the El Paso submarket breakdown table until it accrues true monthly data. June 2026 appended 2026-07-04 from the 6/1/2026-6/30/2026 Sold Market Analysis (SFR, report dated 7/4/2026), homesSold-weighted per the same ZIP-to-Area map (northeast 79904/79924/79934; east 79925/79935/79936; far-east 79938; horizon-socorro 79927/79928; west-upper-valley 79911/79912/79922/79932; lower-valley 79905/79907/79915; central-downtown 79901/79902/79903/79930). July 2026 appended 2026-08-03 from the 7/1/2026-7/31/2026 Sold Market Analysis (SFR, report dated 8/3/2026), homesSold-weighted per the same ZIP-to-Area map. Note: the July report prints 79934 Percent-of-List at 115 (new-construction-heavy ZIP); taken as-is pending verification, it drives the elevated northeast (1.06) and all-el-paso (1.02) listToSaleRatio this month. July 2026 refreshed 2026-08-05 from the 8/5 re-export (report dated 8/5/2026): 5 late-recorded closings (79938 x2, 79928, 79907, 79915) landed after the 8/3 pull; 79934's Percent-of-List remained 115, corroborated as a builder-closing pattern by 79928 printing 104 (the metro's two new-construction ZIPs are the only ones above 100). August 2026 appended 2026-09-01 from the 8/1/2026-8/31/2026 Sold Market Analysis (SFR, report dated 9/1/2026), homesSold-weighted per the same ZIP-to-Area map. The citywide listToSaleRatio returned to 0.99: 79934 printed 100 and 79928 printed 99, so July's builder-driven 1.02 did not repeat. Aggregation re-verified against this report's Last-Year columns: northeast and east reproduce the stored 2025-08 rows exactly; the stored central-downtown and lower-valley 2025-08 rows were built with 79905 in central-downtown (the current map places it in lower-valley), so year-over-year reads for those two areas against 2025 months carry that ZIP difference. Resale sale-to-original-list (resaleHomesSold, resaleSaleToListRatio, resaleSaleToOriginalListRatio) added 2026-09-17 for every El Paso area, 2025-01 onward: a FlexMLS closed search (Single Family Residence, New Home or Resale = Resale, one calendar month by sold date) returns each sale's sold, list and original list price; each sale's ratio is averaged per area over the same ZIP-to-Area map, all-el-paso being the union of the mapped ZIPs, so its count differs from homesSold (new builds out, unmapped ZIPs out). listToSaleRatio (the Sold Market Analysis Percent-of-List) was confirmed the same day to be sale price over the FINAL list price, truncated to a whole percent. Sep 2026 appended 2026-10-02 from the Sold Market Analysis dated 10/2/2026 (9/1/2026 to 9/30/2026); resale original-ask fields merged 2026-10-02 from a FlexMLS closed search (500 resale SFR closings, 475 inside the seven areas). Median and average prices reflect closed sales. Data through September 2026.